Designing a unified portal for a bank's institutional trust business: workarounds as the map
Financial services · Institutional client portal
A large bank's institutional trust business served corporate, municipal, and structured-finance clients through a patchwork of separate systems. As a consulting team, we led the research and design for two of its business lines, with the goal of shaping a single portal for clients and for the bank staff who serve them.
The problem: These accounts hold bond proceeds and move large payments, so accuracy matters more than speed, and a wrong number or a missed deadline has real consequences. The systems clients and staff relied on didn't connect to each other, so people built their own safeguards: spreadsheets to double-check the data, printed reports, and lists of logins for each system. Those safeguards kept work accurate, but they were also a clear sign of where the systems were failing.
How we researched it: We started with stakeholder interviews to understand goals, constraints, and the brand the bank wanted to protect. Then we watched people work. Contextual inquiries with bank employees and with institutional clients showed the real tasks, the real tools, and the workarounds in between. From there we built personas for both audiences in each business line, and turned the findings into recommendations organized by theme.
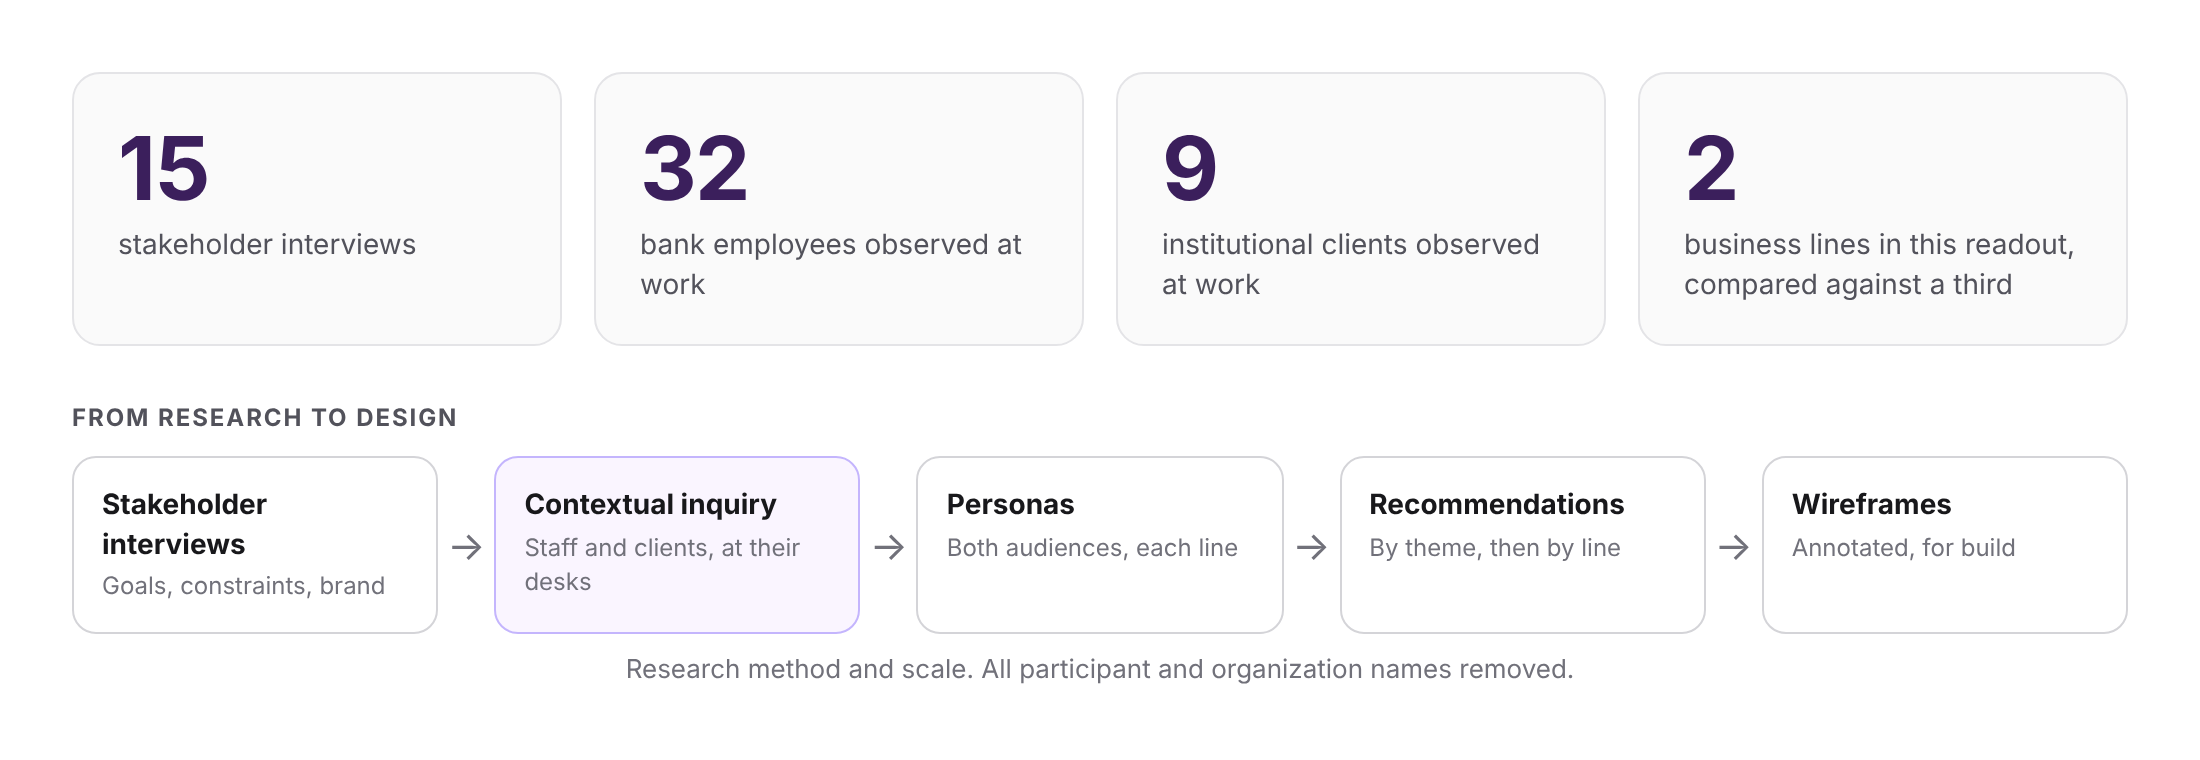
Research method and scale. All participant and organization names removed.
Workarounds as the map: The most useful finding was the list of workarounds. Each one pointed to a specific failure and, in turn, to a design direction. People re-checked large payments that were entered by hand, so the recommendations call for error prevention in payment processing. Reminders disappeared with no proof they were completed, so they call for alerts that show what is due, missed, and done. Separate logins per system led to password cheat sheets, so they call for a single sign-on. Reports and documents moved by email, so the portal gives them a shared file cabinet.
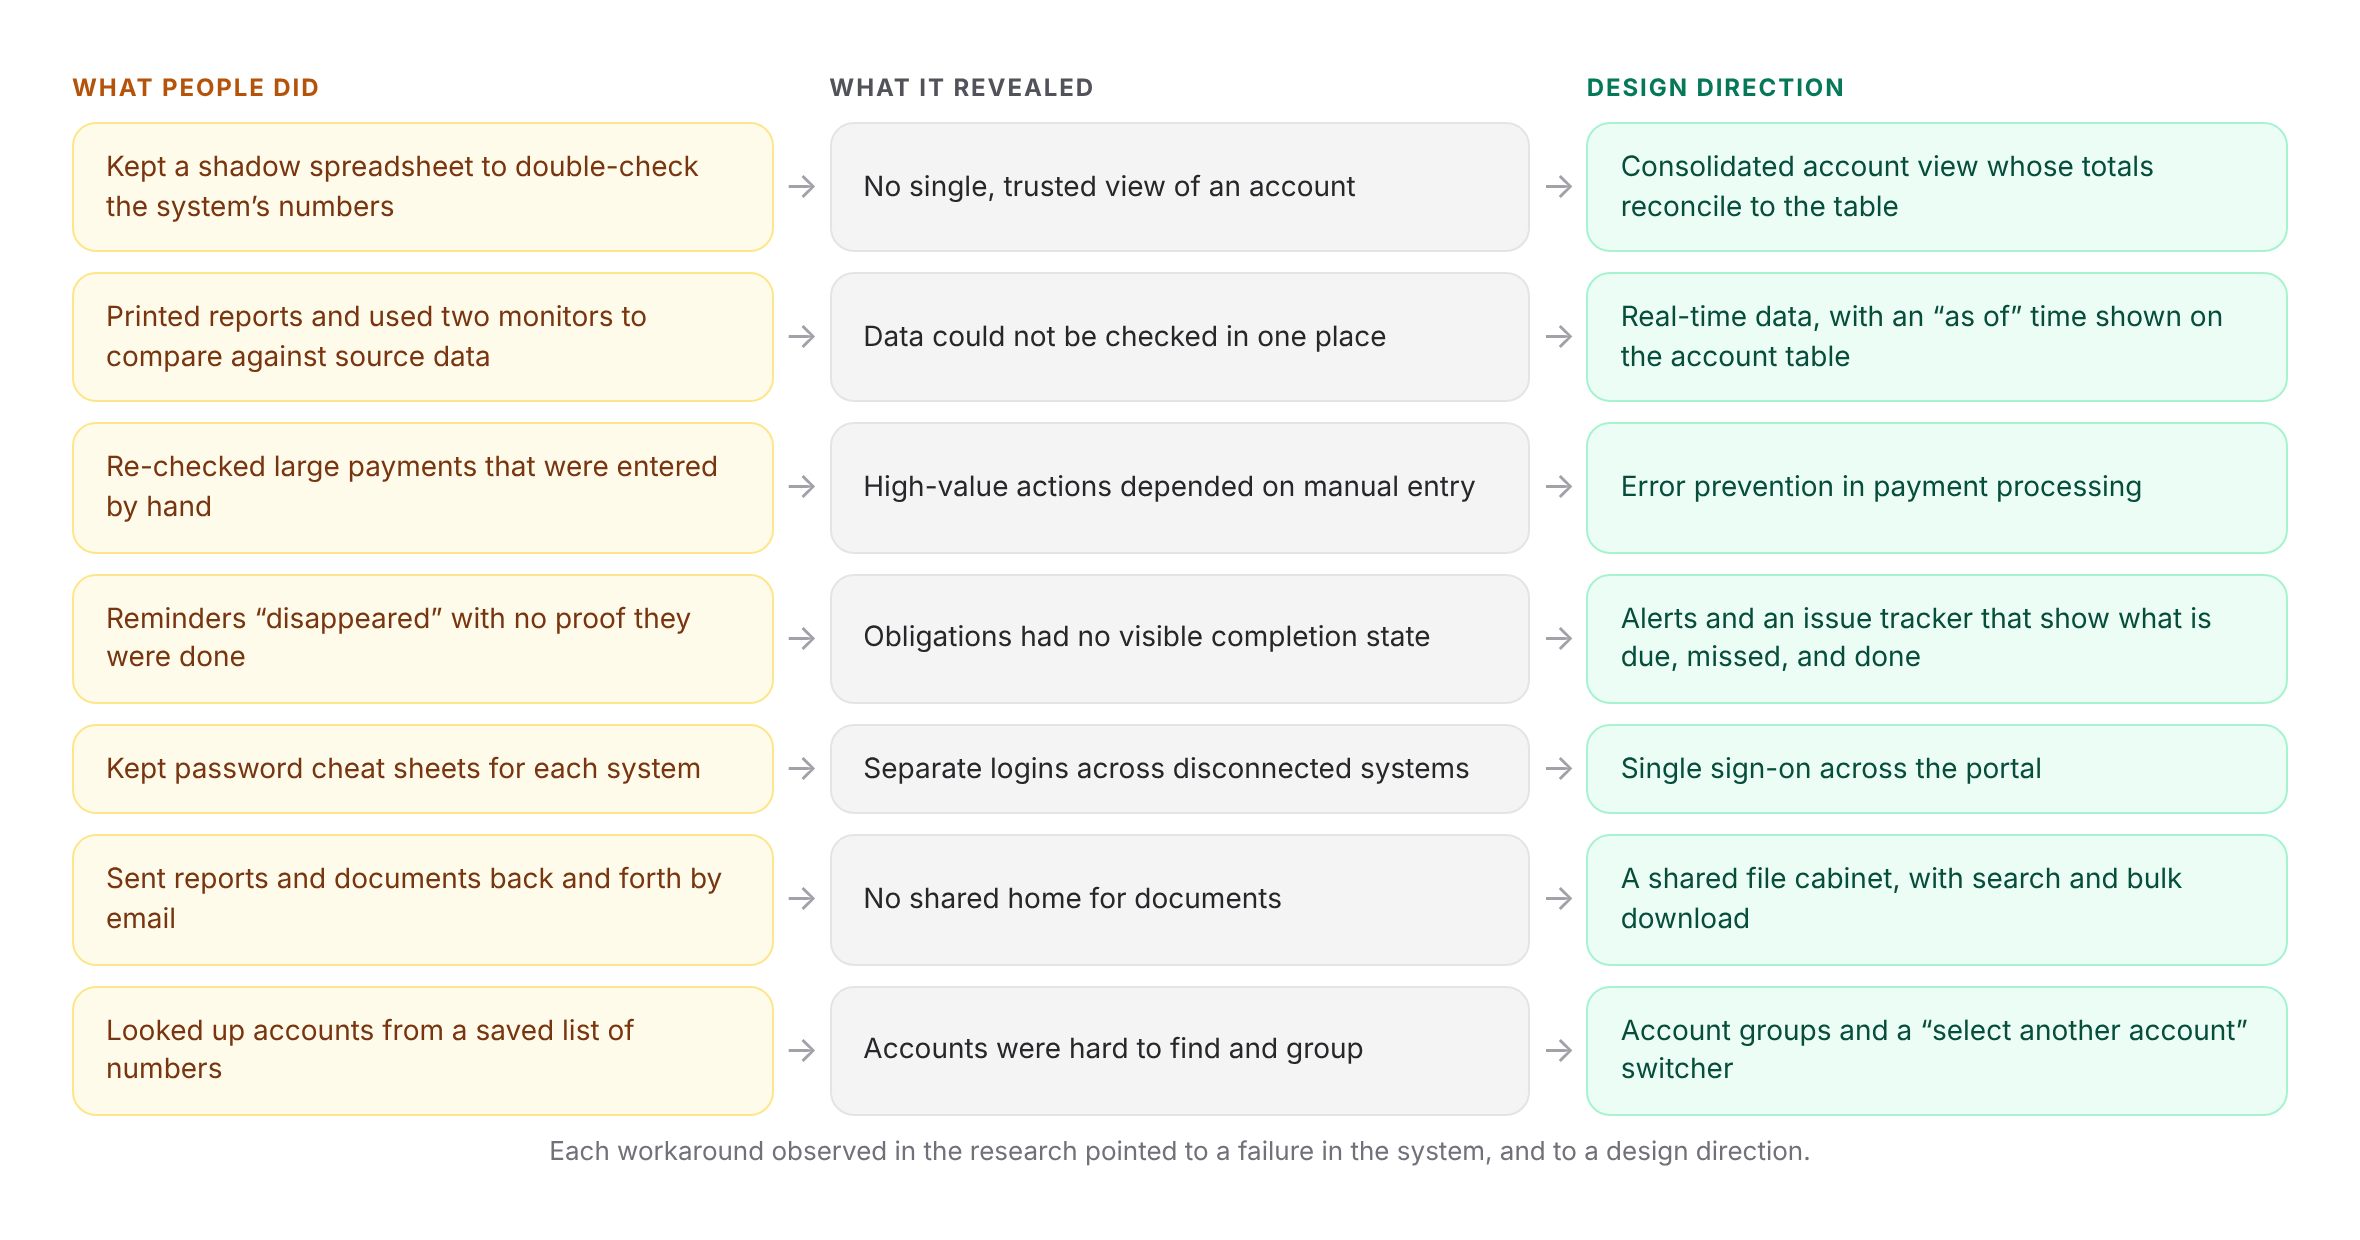
Each workaround observed in the research pointed to a failure in the system, and to a design direction.
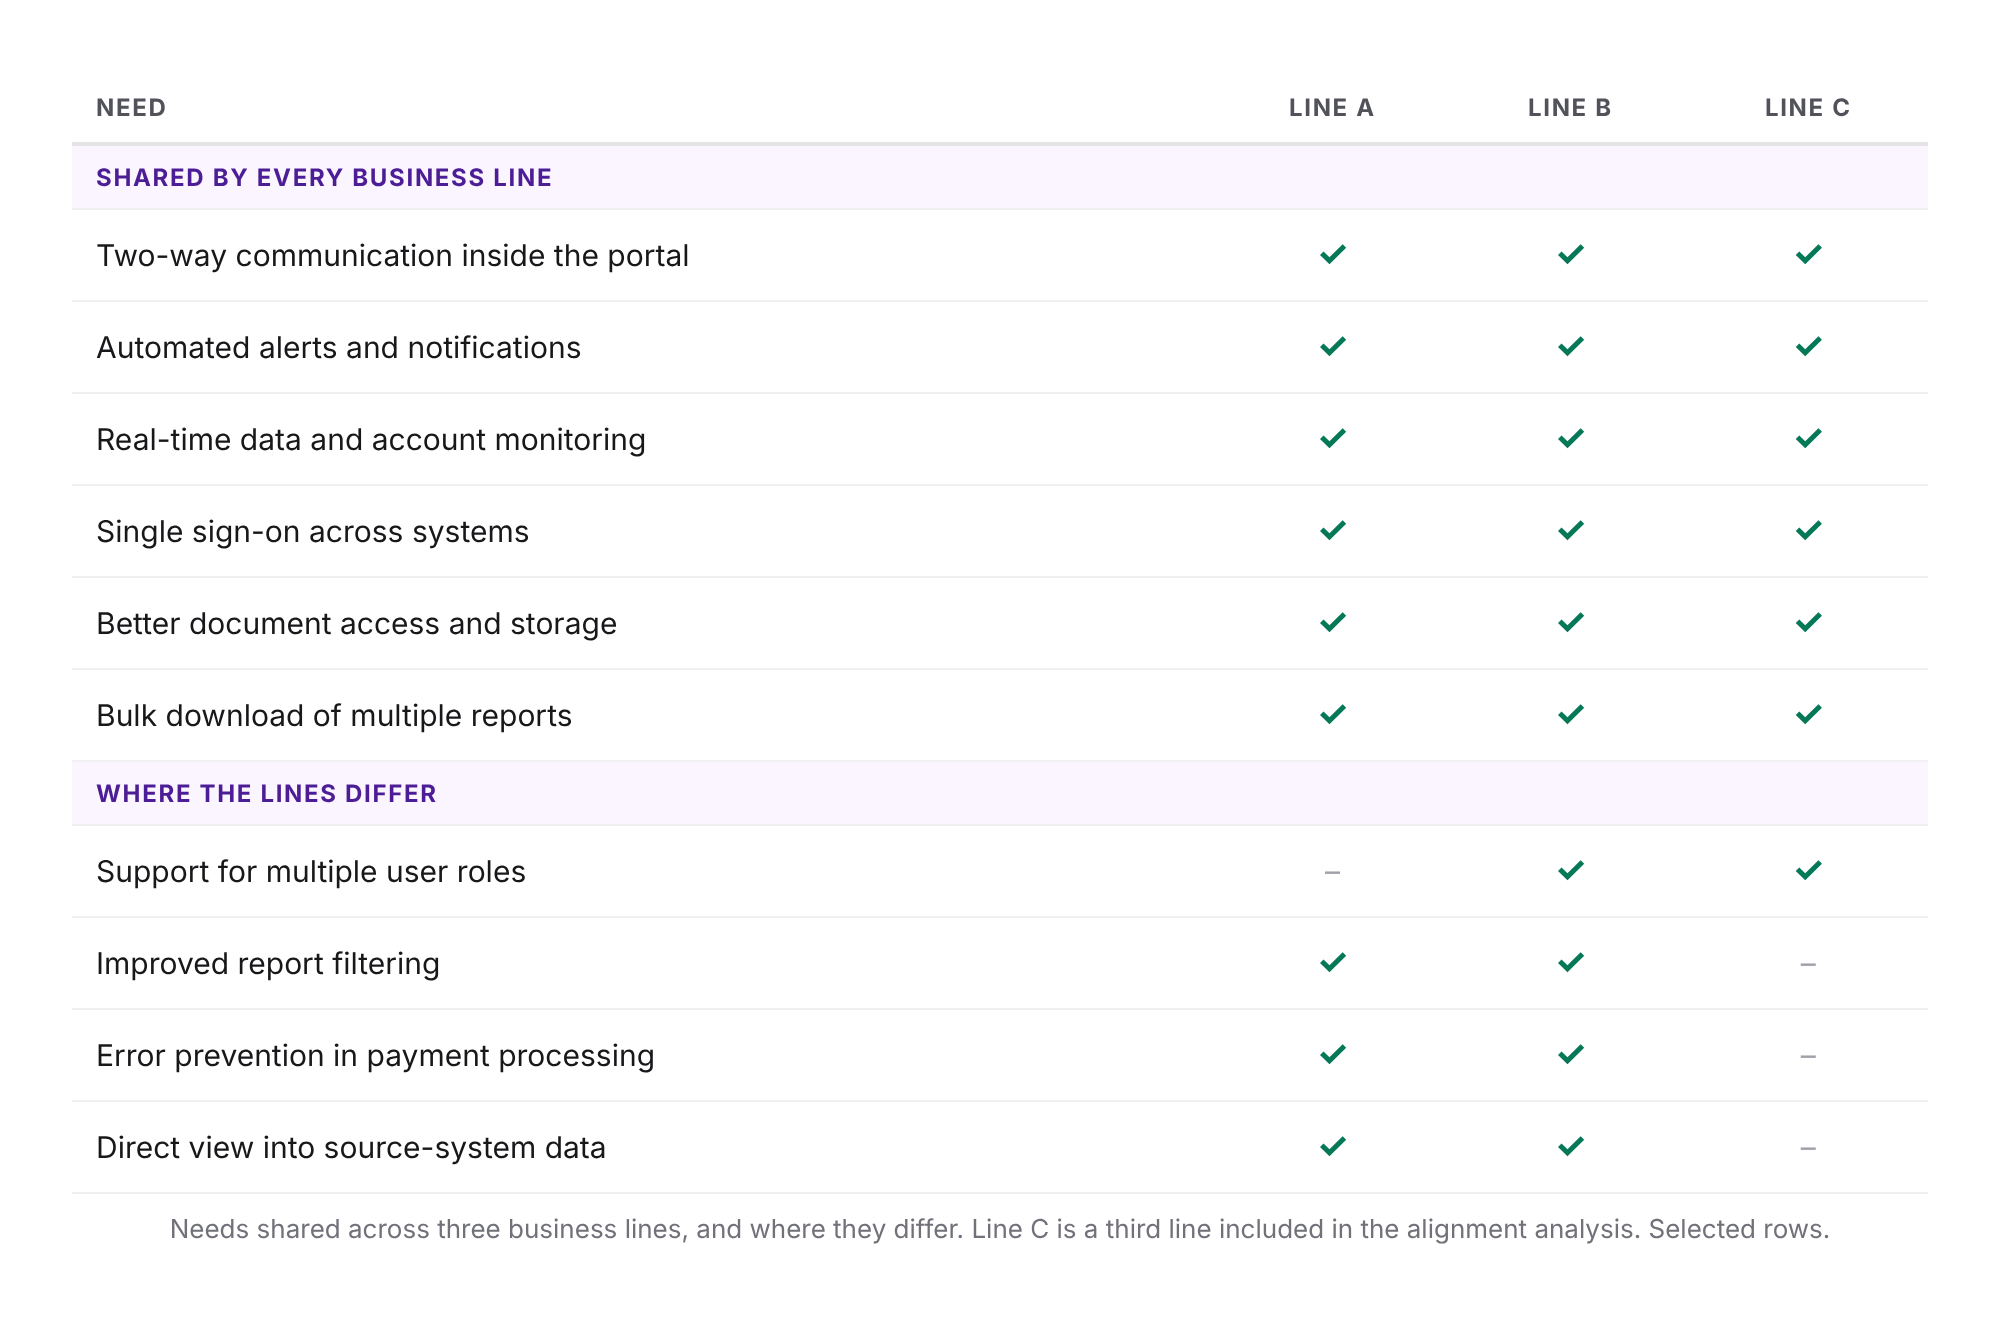
Needs shared across three business lines, and where they differ. Line C is a third line included in the alignment analysis. Selected rows.
Designing the account view: The account page is where the research shows up most directly. It opens with a summary whose totals reconcile exactly to the account table below, so a user can trust the numbers without rebuilding them in a spreadsheet. Key data points such as the next payment date and final maturity sit beside the totals. The account table shows when its data was last updated. Tabs lead into the debt schedule and payments, with row-level detail in a lightbox. A switcher moves between accounts, and an export action lets clients take the data into their own systems.
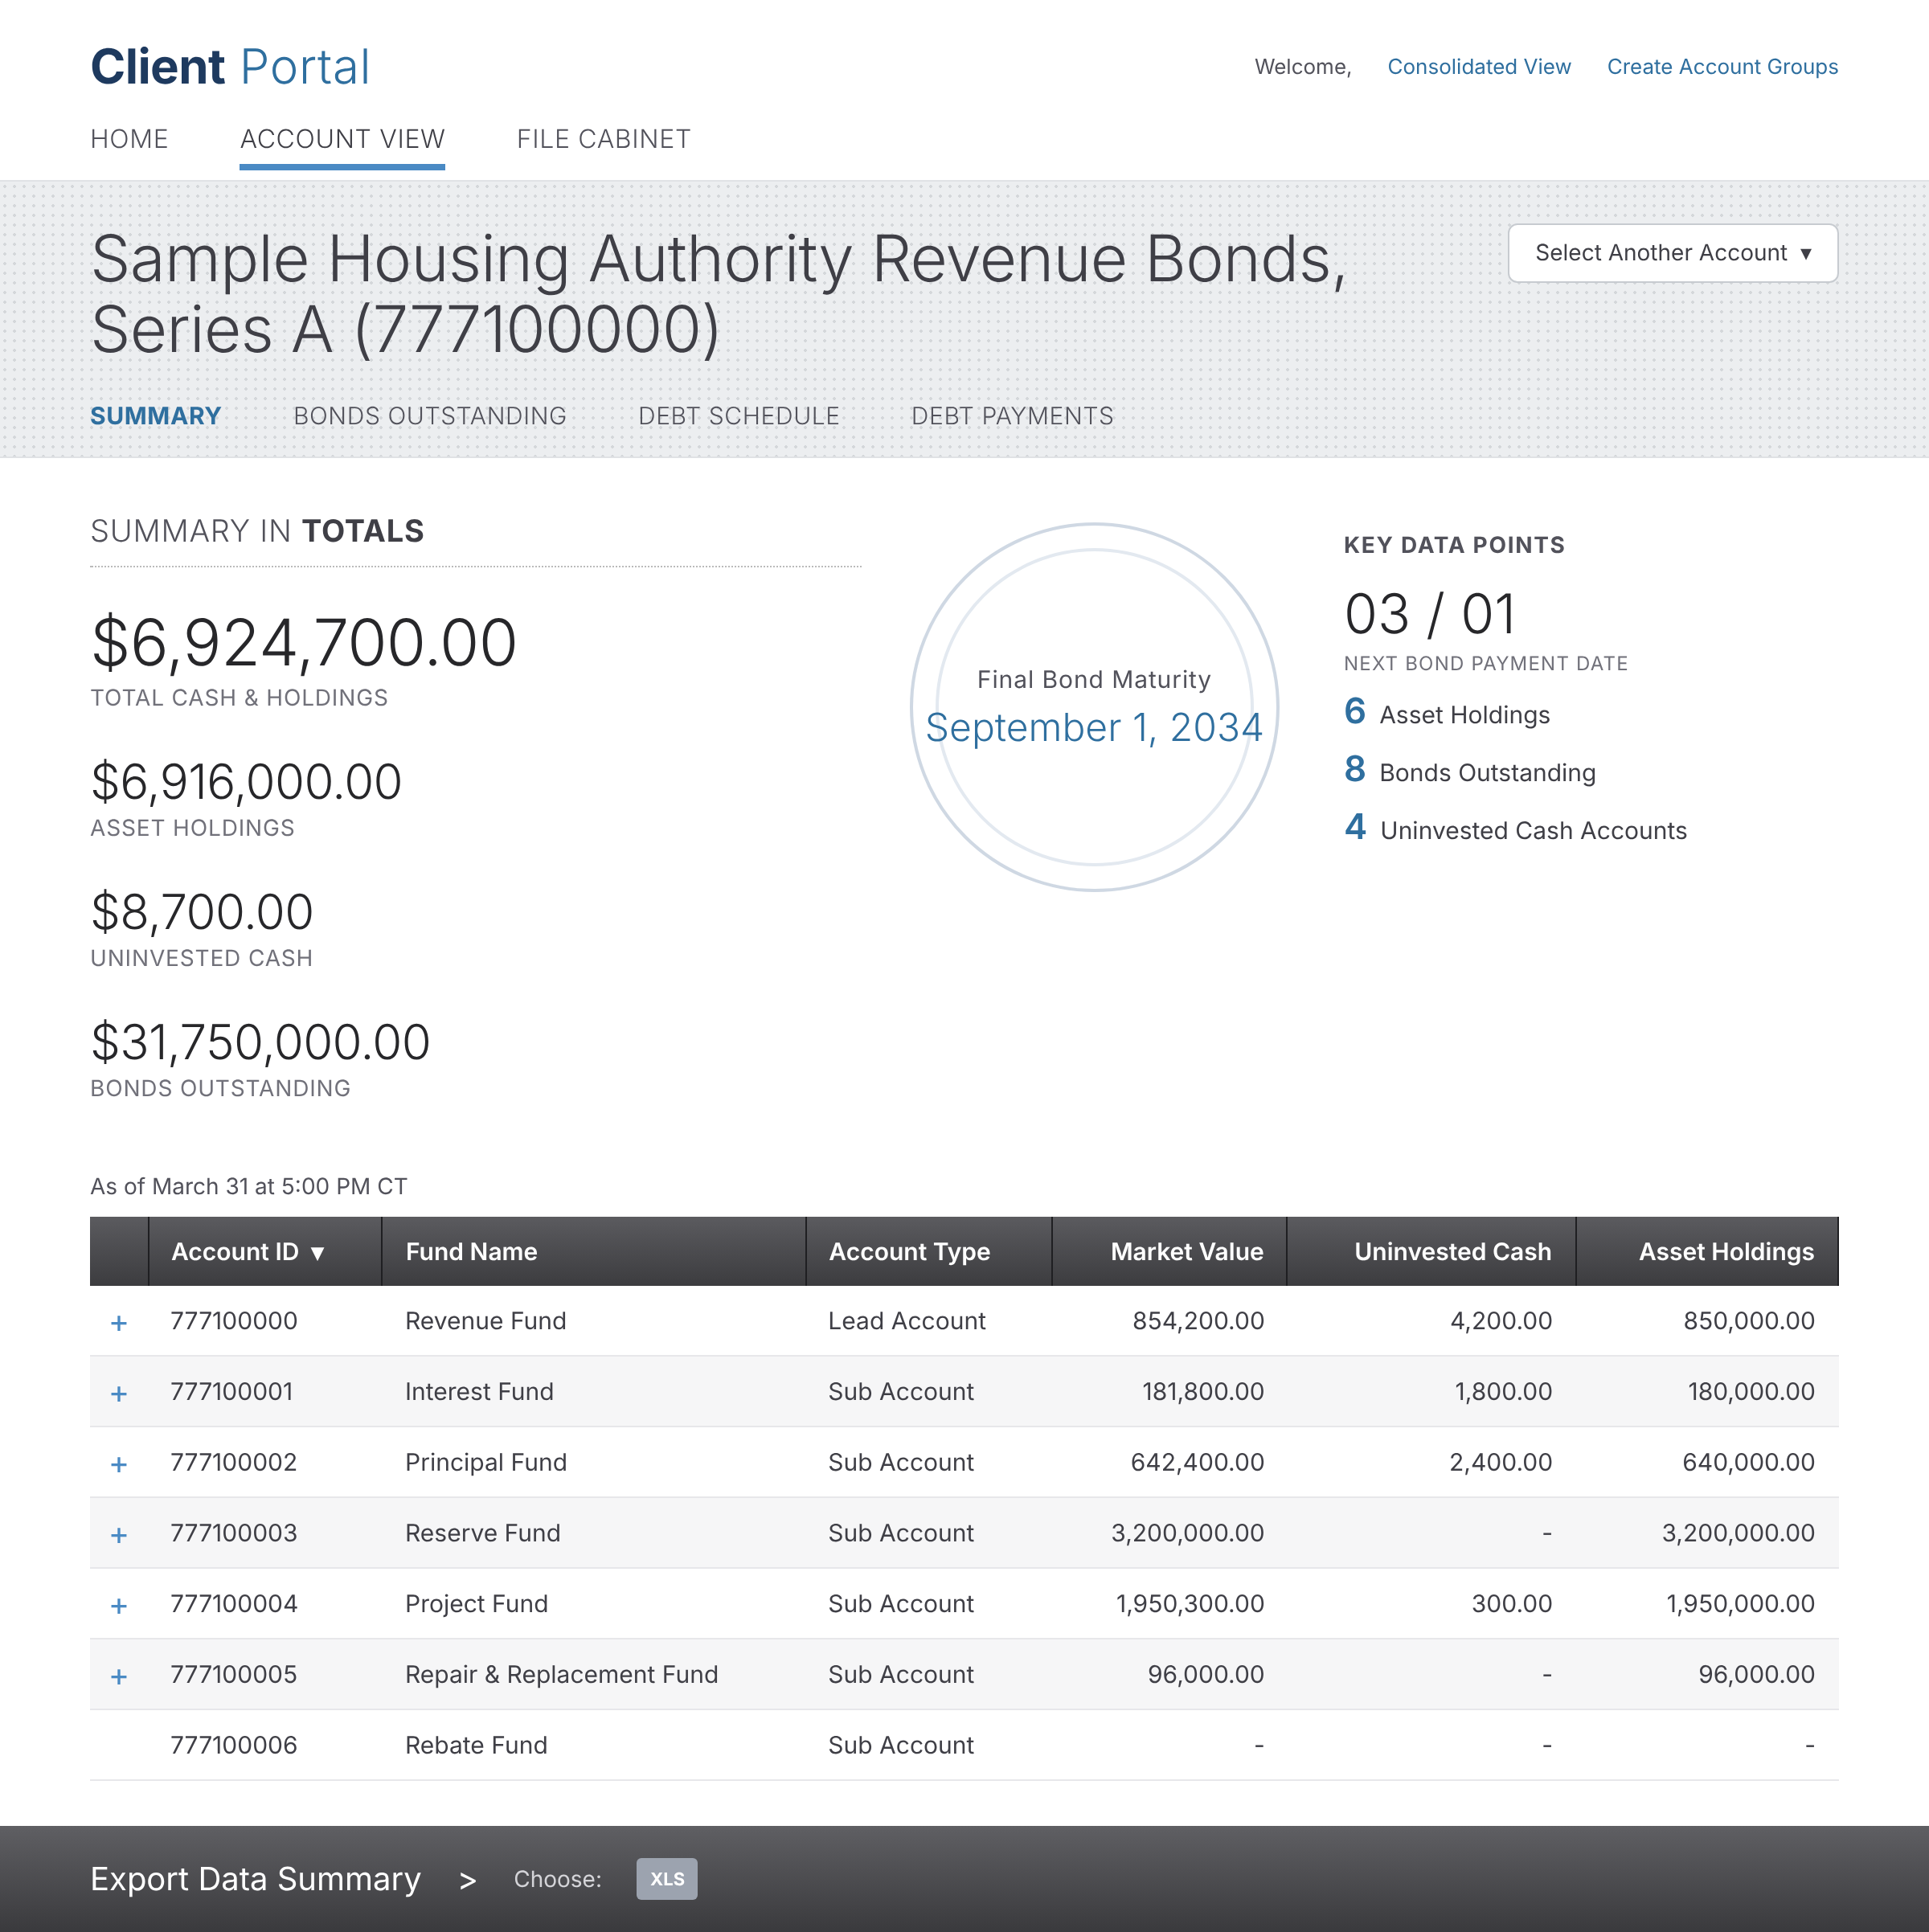
The account summary. Prototype screen with fictional data.
Documenting it for build: The wireframes were annotated page by page: how a person arrives, what they can do, and what the system does next. A shared annotation library defined common patterns once, such as tables, lightboxes, uploads, and notifications, so the pieces behaved consistently across the portal.
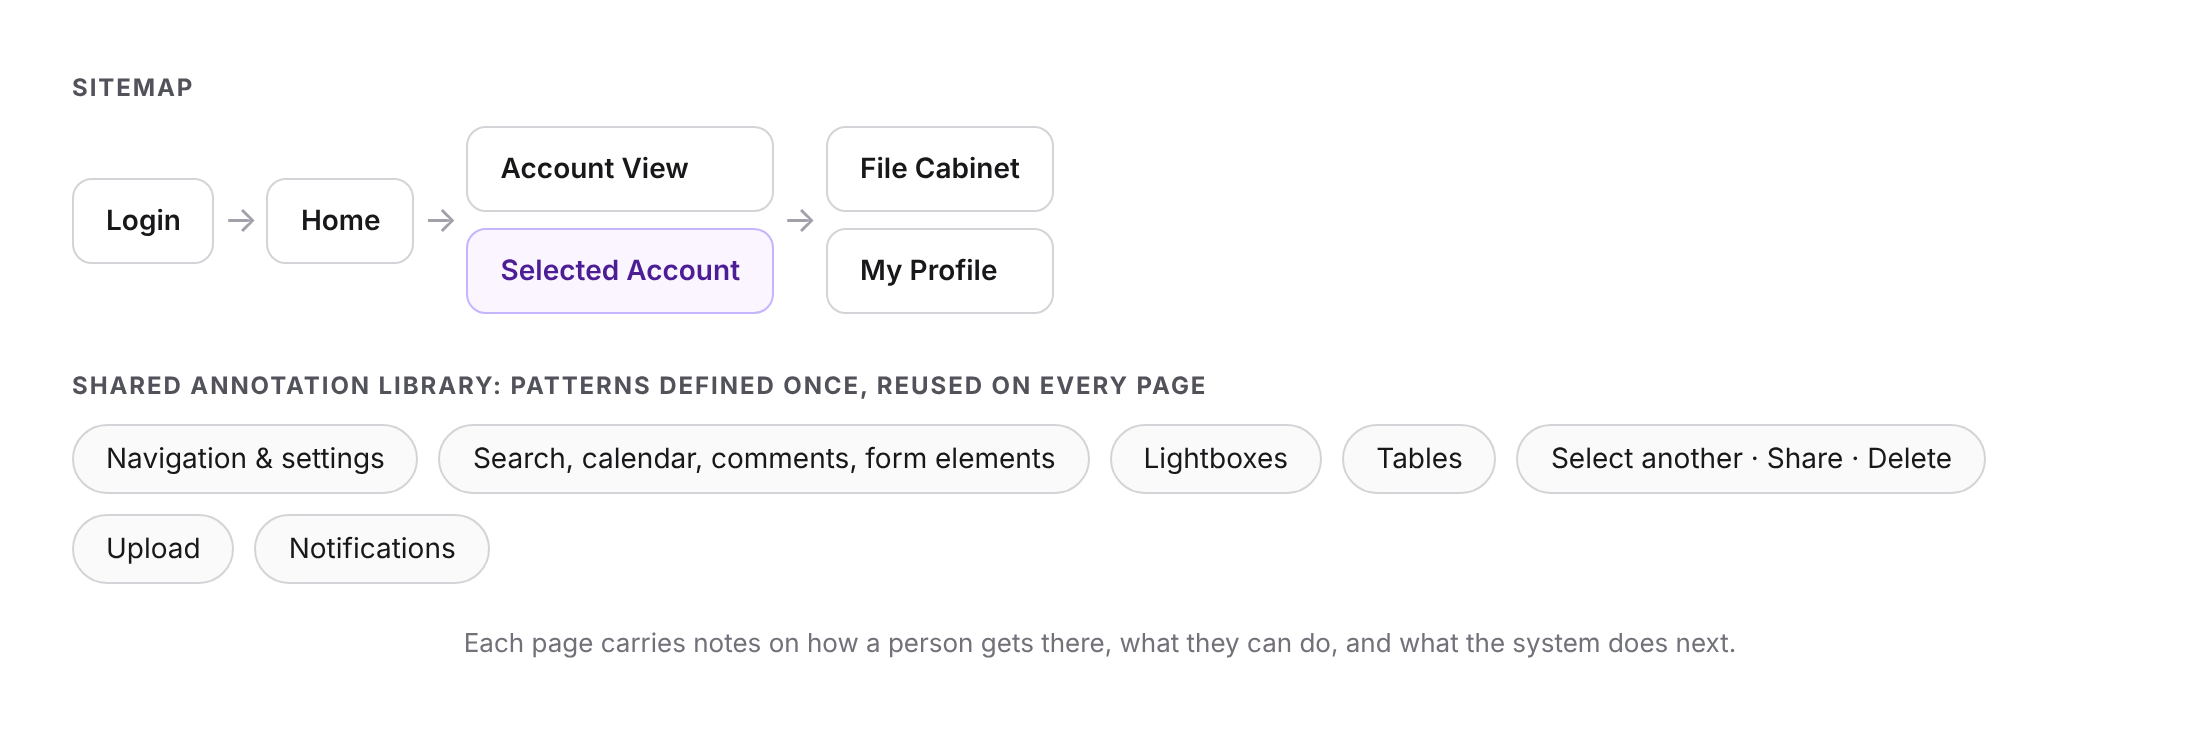
Each page carries notes on how a person gets there, what they can do, and what the system does next.
Our role: We were the consulting team that carried the work from research through design. We led two of the business lines and were accountable for the quality of the work, hitting deadlines, and delivery.
What was delivered: Research findings and personas for each business line, a shared set of recommendations, and an annotated wireframe set for the first release.
Note on source material: This case study is adapted from a consulting engagement for a large financial institution earlier in our careers. All organization, product, system, and participant names have been removed, and all figures shown are fictional. The screens are recreations of the wireframes with fictional data. Only the approach and structure are represented.